Coaching and teaching - many through the mortgage process and others on the field

Tag: supply and demand

More Housing Data – Supply Still Not Enough

Current housing data suggests that the likelihood of a “housing bubble” or market correction is extraordinarily unlikely, as there’s far more demand than supply for housing. 

That’s not what many are hearing from the media sirens out there, but the numbers tell the true story.

Data also shows that there are more households being formed than homes being built. That means demand will continue to be higher than supply moving forward.

This data seems to strongly imply that housing prices will not be going down in the near future, although the rate of appreciation will be slower than in 2020 through 2022.

Housing Starts and Permits

Housing Starts in January were down 4.5% to a 1.3M unit annualized pace.  Starts are down 21% year-over year…and single-family starts were down 4.3% last month at a 840K pace.  Single family starts are down 27% year-over-year.

Housing permits, which is the future supply, were up 0.1% last month at a 1.34M unit pace and are down 27% year-over year.  Single family permits are down a whopping 40% year-over-year.

Consider this…new household formations for 2023 are estimated at 1.9M and with builders building 1.3M homes (annualized), there doesn’t appear to much vacancy available.  This means tighter supply and increased demand…which means home prices should increase.

Also, permits are the future supply…and with permits at 1.34M compared to 1.9M in household formations. This means supply will remain very tight and should be well below demand, further supporting home prices.

Housing Prices Today

Looking at national data, Nataliya Polkovnichenko, Ph.D., Supervisory Economist at the Federal Housing Finance Agency (FHFA), explains:

“U.S. house prices were largely unchanged in the last four months and remained near the peak levels reached over the summer of 2022. While higher mortgage rates have suppressed demand, low inventories of homes for sale have helped maintain relatively flat house prices.”

Month-over-month home price changes can be seen in the chart below. The data also shows that price depreciation peaked around August. Since then, any depreciation has been even milder.

In other words, today’s home prices aren’t in some sort of downward free fall that we hear about through many media outlets – and there appears to be no market correction on the horizon.

In Conclusion

Many are attempting right now to time the market, thinking that home prices are in for a big drop, but that clearly isn’t the case…nor is that a good strategy.

Selma Hepp, Chief Economist at CoreLogic, shares:

“. . . while prices continued to fall from November, the rate of decline was lower than that seen in the summer and still adds up to only a 3% cumulative drop in prices since last spring’s peak.”

And when you consider the shortages in inventory and the increases in household formations, I’m confident that there will be upward pricing pressure for buyers very soon.

For a deeper dive on this, you can also find my 2023 Housing and Mortgage Forecast here…

Would you like to learn more?  Contact me to discuss your current situation and how you might be able to take advantage in today’s environment.  It would be my pleasure to help you!

Housing Supply and Demand

As you probably know, the number one driver of economics is supply and demand…and it absolutely applies to today’s housing market.

judges desk with gavel and scales

Supply and demand is a true economic law.  Just like gravity is a physical law, supply and demand is an economic certainty – and it isn’t just a theory.  It’s truth.

With that in mind, supply and demand absolutely applies to real estate.  The less supply, the more demand…and as you probably learned in your Econ 101 class, prices go up.

Understanding Housing Demand

The easiest way to understand the dynamics at play here is to take a look at the demand side first…and this is best shown by the number of new household formations.

Essentially, household formations are number of new households that will be formed at a particular time.  They are based on projections of population by age cohort and age-specific headship rates.

Household formation is the underlying driver of long-term demand for new housing and thus new home construction.

As you can see in the chart above, there are 1.4 million new households being formed in 2022…and this number is a bit higher than average (the green line on the chart).

So, the market needs to account for these 1.4 million new households, either with rental properties or homes.

The Truth About Housing Supply

According to most reports, there are approximately 1.7 million new homes being built this year.  It’s also important to take into account that approximately 100K homes are destroyed annually, that leaves 1.6 million new homes available for the 1.4 million new households (for a surplus of 200K homes).  

This looks like good news! Well, let’s dive a little deeper…

As you can see by the chart above, there will only be 1.3 million homes actually completed this year (and that number seems to be shrinking every month due to labor and supply chain issues). 

And when you factor the 100K destruction number in, the net result is new home supply of only 1.2 million, leaving a 200K shortfall.

Secondly, as you can see by the chart below, there is record low inventory in home here in the US.  Only 1.03 million homes are available today. 

Compare that to 2019 and 2020, where there was nearly TWICE the inventory.

You will notice that there are rises and dips each year…and the increase is due to the spring buying effect, where families want to make sure they’ve found a place by the start of school each year. 

So, the fact that inventory is rising this year is completely normal and expected!

Finally, are there really 1 million homes listed for sale?  Well, yes…but not exactly.

When you consider the number of homes under contract (meaning they are currently showing as available but truly aren’t), the number falls to only 400K available for sale.

As you can see, we are still at near record low inventory…only 33K off of the all-time low, set earlier this year.

Is There a Slowdown Coming?

Well, inventory levels appear to be coming up slightly (much of that having to do with the spring buying/selling season), but not overwhelmingly so.

There will still be a lack of supply for the foreseeable future.  Sure, demand is being tempered a bit by higher interest rates, higher home prices, and stock market/economic instability.

However, there’s still plenty of activity to support price appreciation.  Think about it for a second, people still need places to live…even if they need to pay a bit more to do it.

The meteoric rise in appreciation and home prices may slow (and we are already starting to see that in the price drops of listings), but because of the supply/demand curve, there’s no way that prices will actually depreciate.

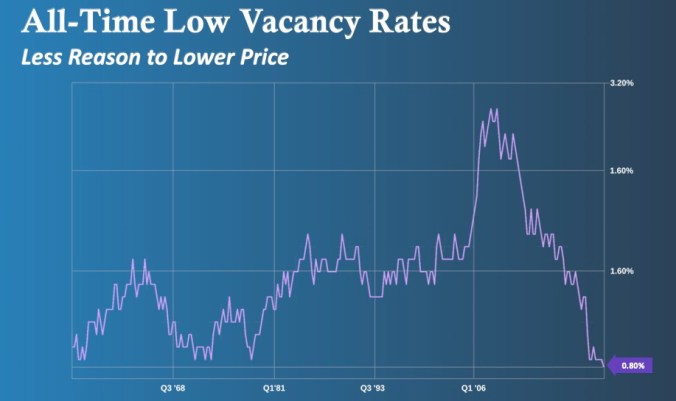
We can see this in the number of actual home vacancies to support this. 

As you can see, vacancies are at all-time lows – meaning that an increase in supply (because of 2nd home or investment property ownership) isn’t likely. 

Take the housing crisis of 2008 for example…where nearly 3% of all properties were vacant – because folks were literally walking away from their investments because the carrying costs of homes became too much.

We are nowhere near that point in today’s environment – meaning that our market is quite strong and should stay healthy.

I hope you find this helpful…and don’t hesitate to contact me to discuss your current situation and how you might be able to take advantage of today’s changing market.  It would be my pleasure to help you!

© 2024 The Lending Coach

Theme by Anders NorenUp ↑